Main Trading Indicators: Top Trading Indicators for Successful Trading
Trading indicators are essential tools for traders to analyze price movements and make informed trading decisions. These indicators help identify trends, momentum, volatility, and potential reversals in the market. Below are some of the most commonly used technical indicators in trading.
Traders have access to hundreds of technical indicators, ranging from simple moving averages to advanced oscillators, each designed for a specific purpose. Some gauge momentum, others analyze volume patterns, and some help identify potential trend reversals.
While no single indicator guarantees success, combining multiple indicators can enhance accuracy and trading effectiveness. The key is to select a complementary set that aligns with your trading strategy.
Below, we explore 10 essential indicators that can serve as the foundation of your technical trading toolkit.
1. Moving average (MA)
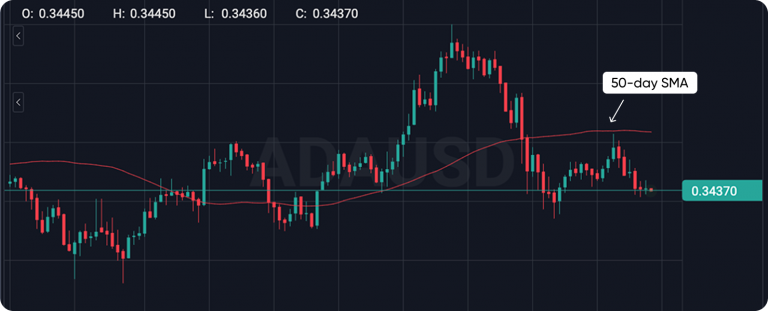
MA is one of the simplest and most commonly used indicators. It smoothes out price data, creating a constantly updated average price over a specific period, and helps traders identify the direction of the trend.
Simple Moving Average (SMA) is calculated by averaging the closing prices over a given period. For instance, a 50-day SMA sums the closing prices over the past 50 days and divides it by 50.
If the price is above the SMA, it suggests an upward trend, while a price below it indicates a downward trend.
2. Relative Strength Index (RSI)
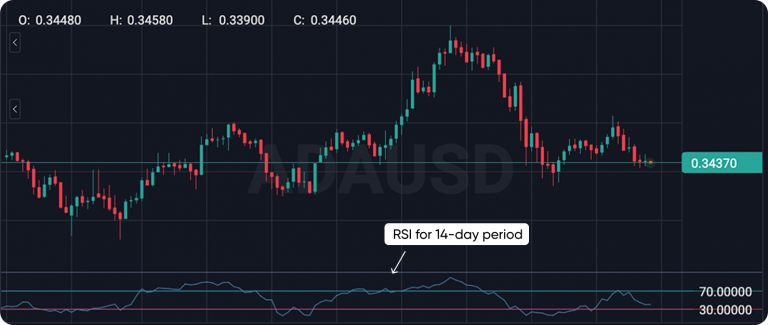
The RSI is a momentum oscillator that measures the speed and change of price movements, indicating whether a currency pair is overbought or oversold.
The RSI ranges from 0 to 100, and traders typically look at levels above 70 as overbought and levels below 30 as oversold.
So, if the RSI of a currency pair like EUR/USD reaches 75, it suggests that the pair is overbought, and a price correction may follow. And if the RSI falls below 30, the pair is oversold, and a price rebound may be imminent.
3. Bollinger Bands
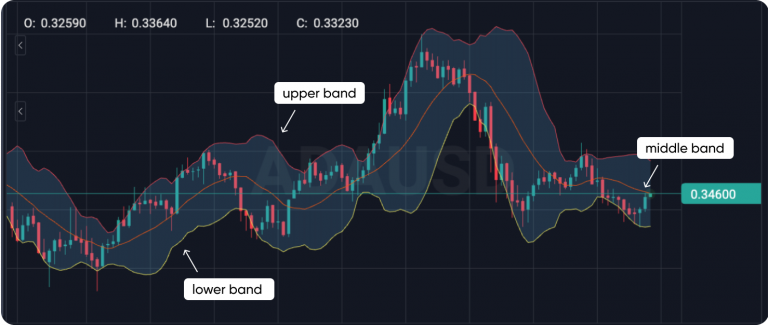
Bollinger Bands consist of three lines: a middle band (usually a 20-day moving average), an upper band, and a lower band. The distance between the upper and lower bands is determined by price volatility, measured using standard deviations.
If the GBP/USD price touches the upper band, it might indicate the market is overbought, suggesting a potential sell opportunity. If the price touches the lower band, it might suggest the market is oversold, presenting a potential buy opportunity.
4. Stochastic Oscillator
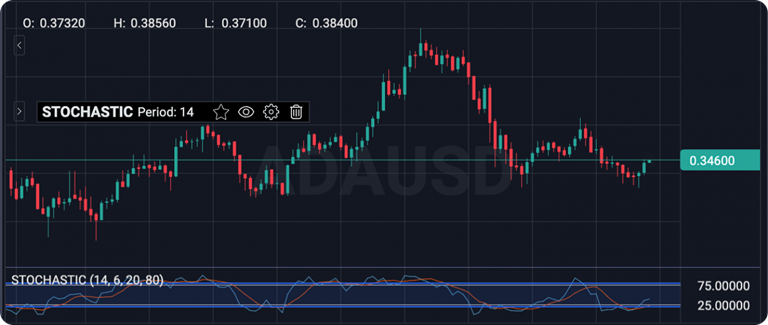
The Stochastic Oscillator is another momentum indicator that compares a particular closing price to its price range over a specific period.
It provides overbought and oversold signals, much like the RSI, and ranges from 0 to 100.
Generally, readings above 80 indicate overbought conditions, while readings below 20 indicate oversold conditions.
5. The Parabolic SAR
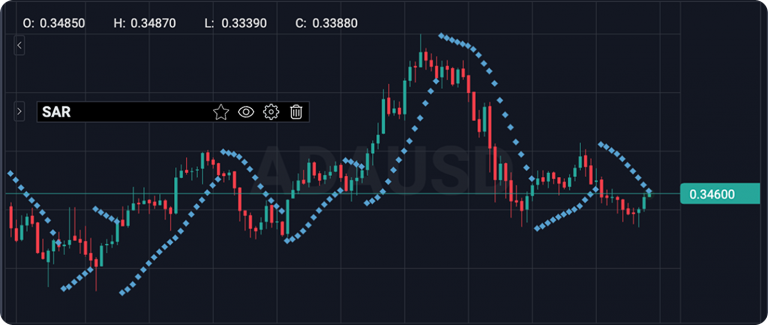
The Parabolic SAR (Stop and Reverse) indicator is a trend-following tool that helps traders determine potential reversal points.
It places dots on the chart to signal where the trend might change direction.
When the dots are below the price, it signals a bullish trend, and when they are above the price, it signals a bearish trend.
6. Average True Range (ATR)
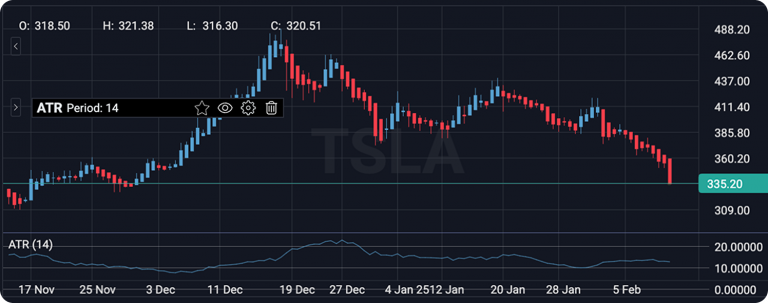
ATR measures market volatility by calculating the average true range of price movements over a set period.
It is calculated by taking the greatest of the following three values:
- Current high minus current low
- Absolute value of the current high minus the previous close
- Absolute value of the current low minus the previous close
A higher ATR indicates greater market volatility, while a lower ATR suggests lower volatility. Traders use ATR to determine stop-loss levels.
7. Fractal Trading Indicator
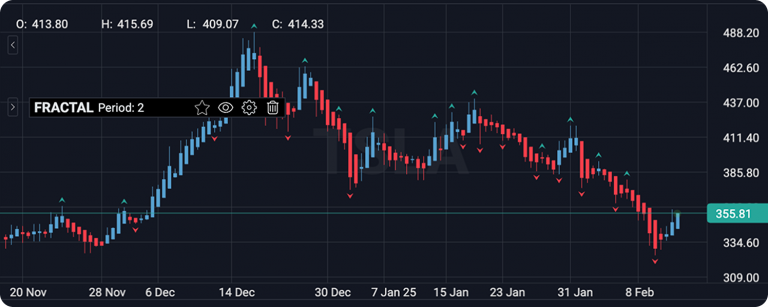
The Fractal Indicator identifies potential reversal points by highlighting recurring price patterns in the market. It consists of a series of at least five candlesticks where the middle one is either the highest high (fractal top) or the lowest low (fractal bottom).
When a fractal top appears, it may signal a potential downward movement, while a fractal bottom suggests an upcoming upward trend.
Traders often use fractals in combination with other indicators like the Alligator or Fibonacci levels for confirmation.
8. Average Directional Index (ADX)
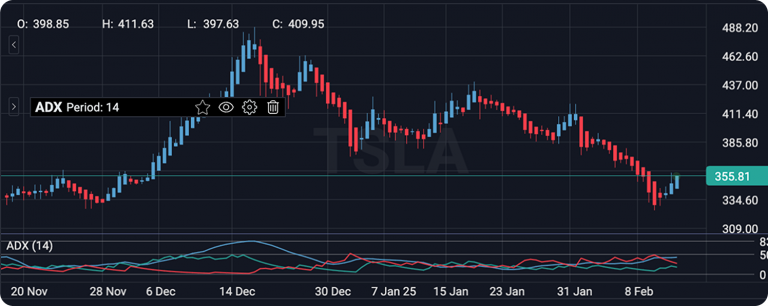
ADX is a trend strength indicator that helps traders determine whether an asset is trending strongly or moving sideways.
It is calculated using the smoothed moving average of the absolute difference between the +DI and -DI (Directional Indicators).
A reading above 25 indicates a strong trend, while a reading below 20 suggests a weak or sideways market. ADX does not indicate trend direction, only the strength of the trend.
9. Awesome Oscillator (AO)
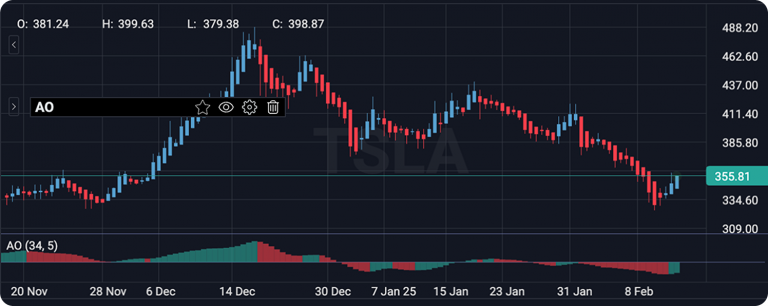
AO is a momentum indicator that measures market momentum by comparing the 34-period and 5-period simple moving averages of midpoints.
AO is plotted as a histogram and helps traders identify potential trend reversals and corrections.
When the AO crosses above the zero line, it suggests bullish momentum, while a cross below the zero line indicates bearish momentum.
10. Aroon Indicator
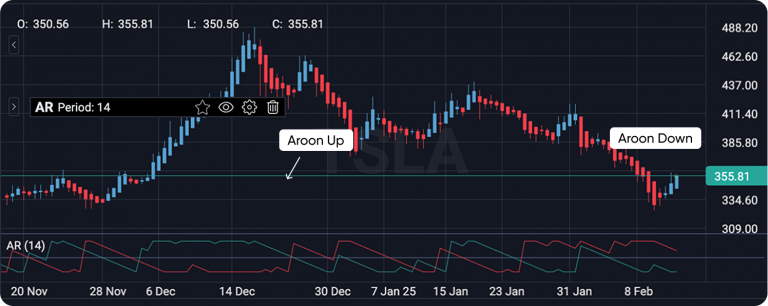
The Aroon Indicator is a technical tool used to identify trends and their strength. It consists of two lines: Aroon Up and Aroon Down. It measures the time elapsed since the highest high and lowest low over a given period, typically 25 days.
- Aroon Up measures the number of periods since the last high.
- Aroon Down measures the number of periods since the last low.
When Aroon Up is above 70 and Aroon Down is below 30, it suggests a strong uptrend. Conversely, when Aroon Down is above 70 and Aroon Up is below 30, it indicates a strong downtrend.
Contact Us
Send us a message and we’ll get back to you within 1 business days!